Monitoring Performance with Pprof
Pprof, a Go profiling tool, helps identify performance bottlenecks in areas like CPU and memory usage. It’s integrated with the controller-runtime library’s HTTP server, enabling profiling via HTTP endpoints. You can visualize the data using go tool pprof. Since Pprof is built into controller-runtime, no separate installation is needed. Manager options make it easy to enable pprof and gather runtime metrics to optimize controller performance.
How to use Pprof?
-
Enabling Pprof
In your
cmd/main.gofile, add the field:mgr, err := ctrl.NewManager(ctrl.GetConfigOrDie(), ctrl.Options{ ... // PprofBindAddress is the TCP address that the controller should bind to // for serving pprof. Specify the manager address and the port that should be bind. PprofBindAddress: ":8082", ... }) -
Test It Out
After enabling Pprof, you need to build and deploy your controller to test it out. Follow the steps in the Quick Start guide to run your project locally or on a cluster.
Then, you can apply your CRs/samples in order to monitor the performance of its controllers.
-
Exporting the data
Using
curl, export the profiling statistics to a file like this:# Note that we are using the bind host and port configured via the # Manager Options in the cmd/main.go curl -s "http://127.0.0.1:8082/debug/pprof/profile" > ./cpu-profile.out -
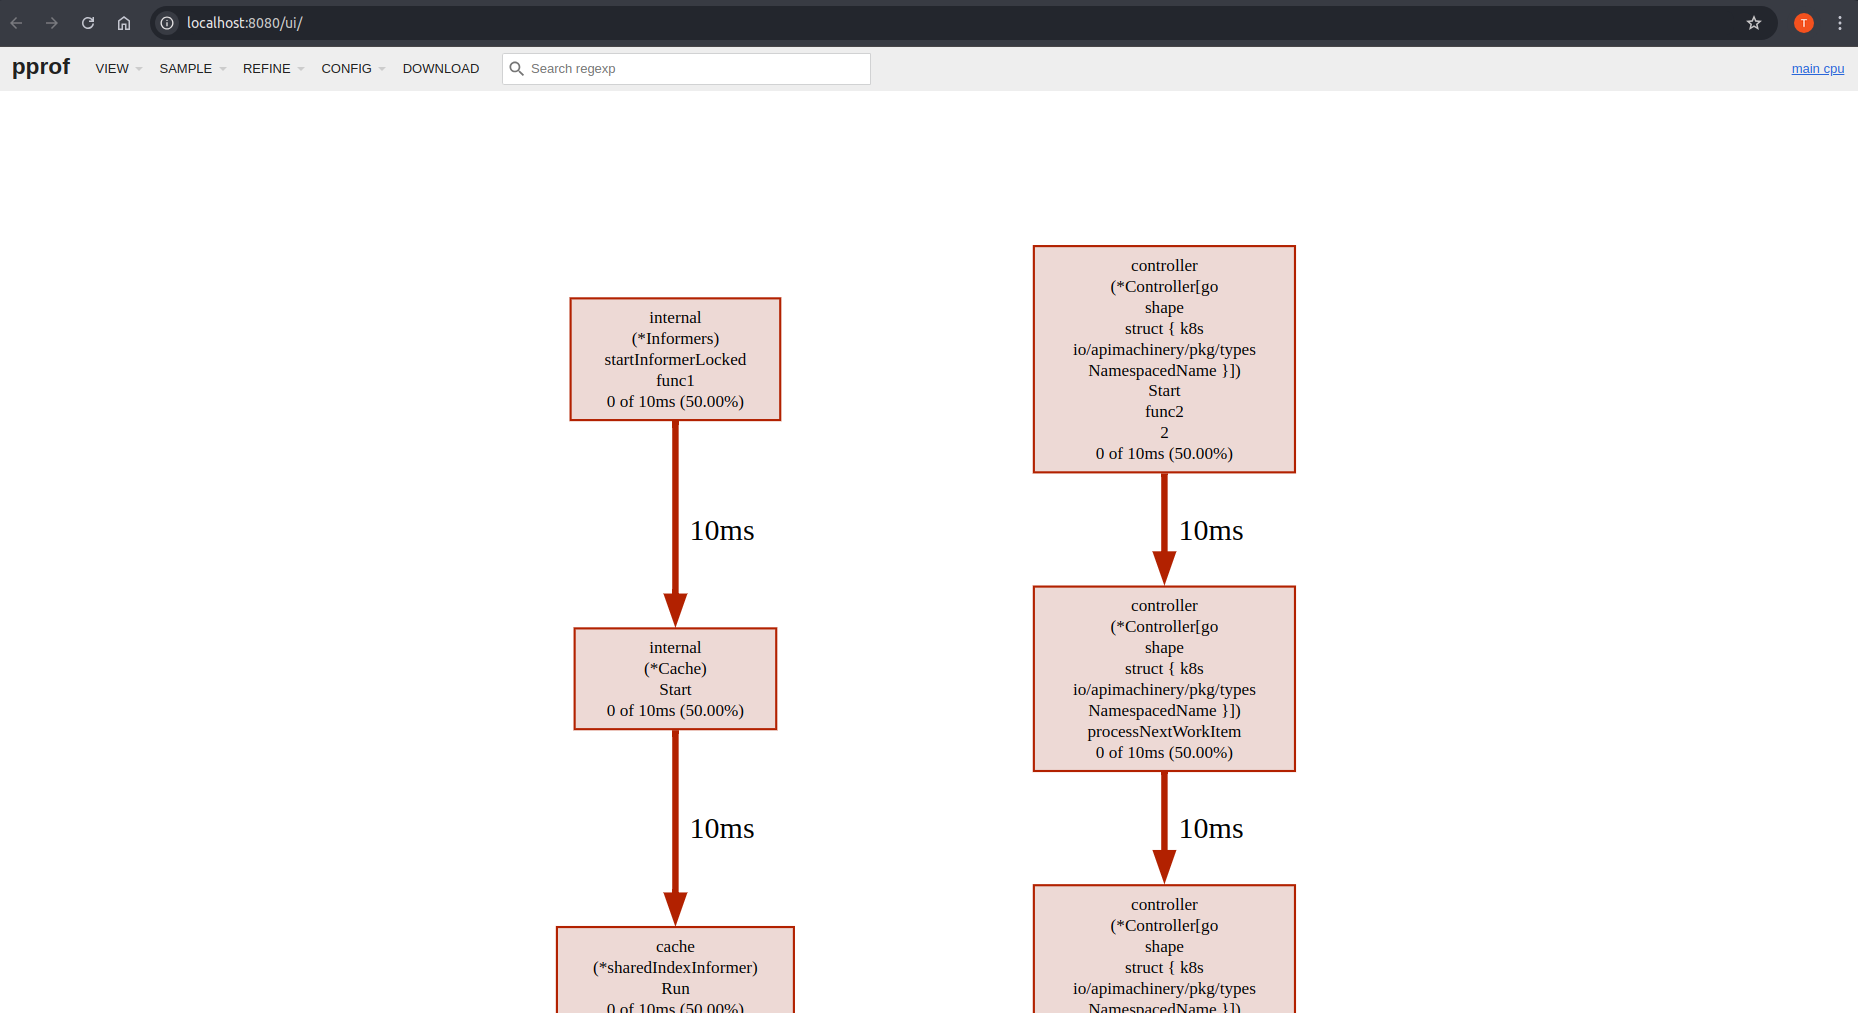
Visualizing the results on Browser
# Go tool will open a session on port 8080.
# You can change this as per your own need.
go tool pprof -http=:8080 ./cpu-profile.out
Visualization results will vary depending on the deployed workload, and the Controller’s behavior. However, you’ll see the result on your browser similar to this one: